The method lists the equipment that is important in a brewery microbiology laboratory.
Microbiology laboratories in the brewing and beverage industry and their suppliers.
Light microscope (bright field/dark field/phase contrast)
The light microscope plays a central role in the analysis of microbiological samples. Figure 1 gives an example of an optical microscope. The annotations are intended to briefly explain the most important structural components and mode of operation. The aim is to provide the necessary information to enable a company to assess whether the microscope used is suitable in principle or to ensure that important hardware is correctly configured in the event of a new purchase. No information is provided here on the correct adjustment and commissioning (e.g. Köhler illumination). More detailed information on this can be found in Reference 1 (p. 203-233).
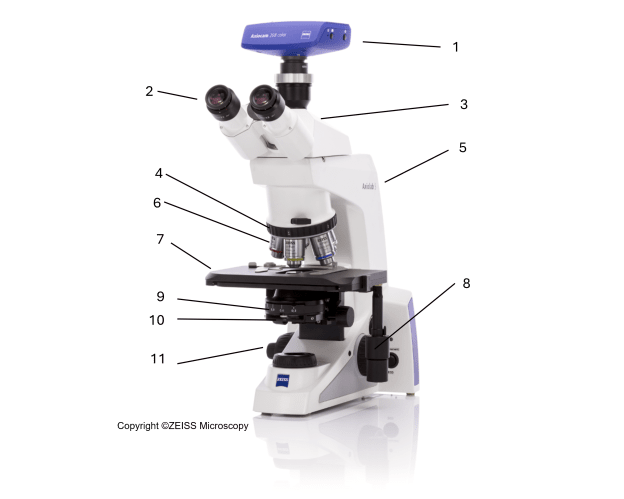
| Fig. 1: Structure and components of an optical microscope | |
| 1 | Digital camera |
| 2 | Eyepiece / ocular lenses |
| 3 | Binocular tube |
| 4 | Objective turret |
| 5 | Arm |
| 6 | Objective lenses |
| 7 | Stage (cross table) |
| 8 | Coaxial drive to move specimen |
| 9 | Aperture diaphragm rotator |
| 10 | Condenser |
| 11 | Coaxial drive to move specimen |
Design and function of an optical microscope [2, 3, 4, 5]
The light microscope consists of two different optical systems that magnify the objects to be examined in two stages:
Objective: produces a magnified, laterally inverted projection image of the objects to be observed, referred to as the intermediate image
Eyepiece: a magnifying glass that is used to enlarge the intermediate image to the final image
The total magnification is therefore the product of the eyepiece and objective magnification. The quality of the objectives is critical to the performance of a microscope. The structures that the objective does not show in the intermediate image cannot be magnified, even with high-quality eyepieces.
An important parameter, besides the total magnification, is the resolving power of a microscope. The resolving power is determined by the numerical aperture of the objective. In simple terms, the objective's resolving power depends on how much light enters the objective from a structure of the specimen. This amount of light is, in turn, dependent on the aperture angle of the corresponding objective. The larger the aperture angle, the better a lens resolves the details of a specimen. However, it is the numerical aperture (= objective aperture), not the aperture angle, that is indicated on the objective. How well a lens resolves details depends not only on the aperture angle but also on the refractive index of the medium between the cover glass and the lens. The higher the numerical aperture, the greater the resolving power of a lens (Fig. 2). If there is air between the lens and the cover glass (refractive index approx. 1.0), the resolving power is only calculated according to the sine of half the aperture angle. The highest achieveable value of the numerical aperture in theory would be exactly 1.0. However, this would require an objective with an infinitely large front lens and a working distance close to zero (= distance between objective and specimen). For obvious reasons, such an objective cannot exist. The numerical aperture that can be achieved in practice is therefore a maximum of 0.95.
The numerical aperture A is calculated as follows:
A = n × sin σ
n: Refractive index of the medium between the cover glass and the front lens of the objective (the refractive index is approx. 1 for air)
σ: Half the aperture angle of the lens

Fig. 2: Relationship between aperture angle and resolving power
Source: http://www.mikroskopie.de/kurse/apertur.htm (accessed on 17.11.2024)
Simplified diagram of the aperture angle
Left: Objective with large aperture angle and therefore high resolution
Right: Objective with small aperture angle and therefore low resolution
An increase in resolution could be achieved by using special objective lenses that are suitable for the use of immersion oil. With these immersion lenses, an immersion oil with a higher refractive index is applied between the cover glass and the lens. This means that even more strongly inclined light rays still reach the lens. In this case, the lens is immersed in the drop of immersion oil. The lenses must be cleaned after use.
As the resolving power depends on the "amount of light" absorbed by the lens, the resolving power of the lens naturally increases with the numerical aperture. Oil immersion lenses can achieve numerical apertures of up to around 1.40. Higher numerical apertures cannot be achieved with conventional light microscopes. The ability of an objective to resolve two neighbouring details in the specimen depends on its numerical aperture.
The following formula is used to calculate the theoretically possible resolving power of a lens from the numerical aperture:
d = λ/2 × A
d: minimum distance between two points that can still be recognised
λ: wavelength of the light
A: numerical aperture (n. A.)
The human eye can distinguish details that are about 0.2 to 0.3 mm apart without any additional aids. These values also determine the useful magnification that can be achieved with light microscopes. When using an immersion objective with a high numerical aperture, this maximum magnification, just like the resolving power, is around a factor of 1000, which is why even very expensive microscopes generally do not exceed a total magnification of 1000x.
In principle, it is possible to achieve a certain total microscopic magnification using different combinations of objective and eyepiece. For example, if you combine a 40x objective (n.a. 0.65) and a 25x eyepiece, you will achieve the same total magnification as with the combination of a 100x objective (n.a. 1.25) and a 10x eyepiece. Nevertheless, the microscopic image of both combinations will differ considerably. The numerical aperture of an objective determines its resolving power. The eyepiece can only enlarge the image produced by the objective. Details that are no longer resolved by the objective cannot be added by an eyepiece, no matter how high the magnification. As a rule, the total magnification of objective and eyepiece should not exceed 500 to 1000 times the numerical aperture of the objective used (useful magnification). A 40x objective (n. A. 0.65) in the above combination with a 25x eyepiece provides a thousand-fold magnification, but the image appears "optically empty" as the useful magnification is clearly exceeded.
The following therefore applies to the total useful magnification: useful magnification < A × 1000
The above explanations summarise the following points for use in breweries:
In most cases, dry objectives without oil immersion are recommended for everyday laboratory use. Dry objectives are easier to handle as they do not need to be cleaned.
It should be possible to achieve maximum magnifications of 640x to approx. 800x with dry objectives.
The combination of eyepiece and objective should be smaller than A × 1000.
Lenses with a high aperture provide a high resolution, but the contrast is lower; the reverse is true for lenses with a low aperture.
The values for the eyepiece and objective magnifications are noted on the components. In addition, the numerical aperture is labelled on the objectives next to the objective magnification. For a 10 mm lens, a typical labelling would be: 10/0.25 (10 = magnification, 0.25 = numerical aperture).
Illumination types (bright field/dark field/phase contrast)
By selecting different condensers or by inserting diaphragms into the path of a beam, different display forms (e.g. phase contrast or dark field) can be realised. These diaphragms can be inserted into the condenser using a slider or insertion diaphragms. The most convenient way for the user is to insert the diaphragms using a ring diaphragm turret (see Fig. 1), as all available diaphragms are usually integrated and the appropriate diaphragm can be selected very easily.
Bright-field microscopy:
Bright-field microscopy is the simplest and most basic method using the light microscope. The specimen is illuminated from below by a cone of light. If there is no object in the beam path, the light rays enter the objective unimpeded to obtain a uniformly bright image.
The light path in bright-field microscopy typically looks like this (Fig. 3):

Fig. 3: Light beam path for bright-field microscopy
The objects to be observed (e.g. yeasts and bacteria) are relatively low in contrast, which means that the outline and cell contents of the specimens are difficult to detect. Specimens without staining can therefore only be analysed to a limited extent.
However, bright-field microscopy can be combined well with staining methods. For example, methylene blue is used as a dye to detect live/dead yeast cells, as stained cells stand out well against a light background.
Phase-contrast microscopy:
The phase-contrast method is an imaging technique in light microscopy that enables the direct imaging of structures that have a low inherent contrast and would only be clearly visible with synthetic dye in bright-field microscopy. The physical background of the method will not be discussed here. The advantage of the method is that, in contrast to bright-field microscopy, high-contrast images can be produced without the need for staining.
A special application of phase-contrast microscopy in brewing is to differentiate between living and dead yeast cells: Dead yeast cells appear darker in the microscopic image than live cells.
Dark-field microscopy:
Dark-field microscopy is a highly suitable method for differentiating and identifying microorganisms that are relevant to brewing. It produces a dark image background against which the structures to be observed stand out brightly. This allows high-resolution, high-contrast images to be generated of transparent, low-contrast specimens without the need for prior staining. The entire morphology, i.e. cell shape, cell contents (e.g. lipid granules) and the mobility of objects can be easily observed.
The principle of dark-field microscopy is based on the fact that the objects not only absorb light, but they also always deflect part of the light beam. The central rays of light are blocked out by a central diaphragm (1). This means that only the light rays hitting the edge of the condenser (2) are deflected. The rays intersect in the object plane and pass the lens if there is no deflection. The viewer therefore sees a dark image. As soon as particles are introduced at the object level, they scatter the light, the scattered light enters the lens and can be observed (Fig. 4).

Fig. 4: Light beam path in dark-field microscopy
1. Central aperture
2. Condenser lens
3. Hollow cone of light
4. Specimen level
5. Scattered light that reaches the objective lens
6. Objective lens
The more strongly the objects scatter the light, the more intensely luminous these objects appear when viewed in the dark field. In many cases, this property allows conclusions to be drawn about the organism under observation. For example, endospores are highly refractive and therefore appear in the dark field as objects with an intensely luminous outer shell. Microorganisms with a thick cell wall, e.g. yeasts or lactobacilli, as representatives of gram-positive bacteria, generally also appear highly refractive.
Microorganisms with a thin cell wall, e.g. E. coli or pseudomonads as examples of gram-negative bacteria, often appear less refractive.
The method lists the equipment that is part of a sophisticated set-up in a brewing microbiology laboratory. This additional equipment is less common, but should also be mentioned.
Microbiology laboratories in the brewing and beverage industry and their suppliers
Light microscope with fluorescence
Fluorescence microscopy is a light microscopy method that utilises the physical effect of fluorescence. UV or short-wave visible light of certain wavelengths (excitation light) is absorbed by fluorescent substances and emitted as longer-wave radiation (emitted light) as a result of the Stokes Shift. In contrast to bright-field microscopes, the image is only produced by the emitted light. Fluorescence microscopes are therefore only suitable for samples with inherent fluorescence or for samples into which fluorescent substances can be introduced.
Design and mode of operation:
The desired wavelength is filtered out of a light source using an excitation filter and projected onto a dichroic mirror. Dichroic mirrors only reflect light below a critical wavelength. Above this wavelength, light can pass through the mirror. The excitation light reflected through the objective to the specimen is then absorbed by the electrons of the fluorescent substances. As a result, these reach a higher energy state. However, due to the instability of this state, the electrons revert to their ground state, releasing the energy they have absorbed. The resulting emission light is lower in energy and therefore has a longer wavelength. This longer wavelength emission light reflected by the objective can pass through the dichroic mirror, thereby reaching the eyepiece or detector. An additional optical filter eliminates the remaining excitation light so that, as far as possible, only the emitted light is detected. The image of the specimen then appears in the respective emission colour on a black background.

Fig. 1: Schematic structure of a fluorescence microscope
| Detektor | detector |
| Sperrfilter | emission filter |
| Strahlteiler | dichroic mirror |
| Lichtquelle | light source |
| Anregungsfilter | excitation filter |
| Objektiv | objective |
| Präparat | specimen |
Source: https://de.wikipedia.org/wiki/Fluoreszenzmikroskopie (accessed on 19.10.2024)
Author and licence: Krzysztof Blachnicki, derivative work: user Dietzel65; https://creativecommons.org/licenses/by-sa/3.0/ (accessed on 19.10.2024)
Stereomicroscope
As a special type of light microscope, stereomicroscopes differ from all other microscopes in that they have two separate optical paths. This special feature allows specimens and, in particular, surface structures to be viewed in three dimensions.
Design and mode of operation:
A separate optical path is provided for each eye, with the optical paths travelling at different angles onto the specimen, thereby creating a stereo effect. Special prisms allow objects to be magnified in the correct direction and in three dimensions. The design-related maximum magnification is around 100:1.
Devices for determining cell counts in liquids
The classic method for determining live cell counts is to plate the suspension on a suitable agar plate. However, this method is labour-intensive and time-consuming, and the preparation of any dilution series and plating as well as the evaluation of the results are potential sources of error. It is quicker and easier to determine cell numbers using counting chambers on the microscope or by means of automated cell counting systems.
A wide variety of counting chambers are available on the market – these differ mainly in terms of the applied counting grids and chamber depths. Counting chambers with a chamber depth of 0.1 mm are used for yeasts, whereas counting chambers with a chamber depth of 0.01 mm are used for bacteria. A reference volume corresponding to the count can be calculated from the chamber depth and the counting grid, which outlines defined areas using grid lines. This allows the results to be given in cells/ml or similar. Handheld counters are used for the actual counting process. By treating the sample with the relevant staining reagents, it is also possible to quantify live/dead cells (viability).
Automated counting systems work on the basis of various detection and counting mechanisms.
Cell counting systems with automated image recognition work in a similar way to counting chambers with a defined reference volume and corresponding evaluation algorithms. Depending on the system, the total cell count of the evaluation field is determined. When using staining reagents (e.g. methylene blue), the number of stained cells can also be measured to determine viability. Other systems work with fluorescent dyes that penetrate the cells of the sample and can be identified and counted by an integrated detector. As the corresponding fluorescent dyes can only penetrate and bind to dead cells, only the dead part of the cells is determined without further reagents. However, by using a lysis buffer or similar, the total cell count can also be determined and the viability calculated from both measurements.
Measuring devices based on the principle of Coulter particle counting are suitable for determining the total cell count as well as the size of the measured cells. Coulter counting measures the change in electrical resistance (impedance) between two electrodes arranged individually in reaction chambers. A small volume of the sample to be measured, diluted with a conductive electrolyte solution, is introduced into one chamber and then automatically sucked into the second reaction chamber through a capillary or opening of a suitable size. Each cell displaces a volume of electrolyte corresponding to its own volume and changes the electrical resistance between the electrodes as it passes through the opening. The current voltage or current pulse is measured. A short increase in resistance is detected as a cell. The height of the current pulse is proportional to the volume of the detected cell.
The cell counts of a suspension can also be determined with a flow cytometer, in this case using a laser-based measurement. The sample is passed through the laser beam in a stream of liquid and the light scattering (forward and sideways scattered light) is measured with detectors.
Microbiological safety cabinet
There are basically three classes of microbiological safety cabinets. Class I safety cabinets only offer protection against contamination for the person using the cabinet, but not for the material they are working with. Class II safety cabinets are suitable for use in brewery microbiology labs – they provide protection for both the operator and the sample material. Class III safety cabinets are fully enclosed systems for increased protection of the operator. This is achieved by permanently installed gloves, airlocks, constant negative pressure and supply and exhaust air filtration. However, the increased protection level also leads to more complicated work processes.
Design and function of a Class II safety cabinet:
Room air is drawn in through the front opening and is fed through a HEPA filter together with aerosols and particles. Part of the filtered exhaust air is channelled in a laminar flow from top to bottom along the open front screen and is then extracted back down to the filter together with room air. This circulation principle prevents contamination of the environment and cleans the fresh air drawn in before it comes into contact with the sample material. The safety cabinets are equipped with sensor-controlled function monitoring with an alarm function.
Spectrophotometer
Spectrophotometers are used in brewery analysis to measure concentrations, for example. For this purpose, a beam of light of a specific wavelength is passed through the sample and the light attenuation caused by the sample contents is recorded. Various ready-made cuvette test kits and reagent test systems are available for other applications, e.g. in water analysis or for enzymatic analyses.
A distinction is made between single-beam and dual-beam photometers. While single-beam systems have a better signal-to-noise ratio, dual-beam photometers are characterised by greater measurement stability. The devices commonly used are UV-Vis photometers, which utilise the ultraviolet (UV) range as well as the light visible to the human eye (Vis).
Structure and mode of operation:
A light source emits polychromatic light, which is broken down in the monochromator so that it only leaves at a specific wavelength. The monochromatic light passing through the exit slit then passes through the sample in a cuvette. Part of the light is absorbed here. The downstream detector measures the intensity of the light passing through the sample.

Fig. 2: Measuring principle of a single-beam absorption spectrometer
Set-up of a simple photometer to measure the absorption of individual light frequencies in liquids
| Lichtquelle - weißer Lichtstrahl | light source – white light |
| Blende | slit |
| Prisma | prism |
| monochromatischer Lichtstrahl | monochromatic light |
| Küvette mit Probe | cuvette with sample |
| Emission nach Durchgang durch das Medium | emission after passing through the medium |
| Detektor | detector |
Source: https://de.wikipedia.org/wiki/Spektralphotometer#/media/Datei:Photometer_mit_Monochromator.png (accessed on 19.10.2024)
Author and licence: Autor Sciencia58; https://commons.wikimedia.org/wiki/File:Photometer_mit_Monochromator.png
Centrifuge
Laboratory centrifuges support the separation of substances and are used in sample preparation, for example. Samples are placed in suitable containers and then set in a uniform circular motion in a rotor. The resulting centrifugal force, which depends on the speed and rotor geometry, acts on the sample contents, which are separated according to their inertia.
PCR thermocycler
PCR (polymerase chain reaction) has become an established alternative detection method in the brewery and beverage sector and enables the precise and rapid detection of brewery-relevant bacteria and yeasts. PCR is an in-vitro technique that can be used to specifically amplify deoxyribonucleic acid segments (DNA segments).
In addition to the corresponding PCR chemicals (PCR kits), a PCR thermocycler is a basic requirement for carrying out a PCR. A thermocycler is a device that can carry out the temperature cycling of a PCR independently. A PCR thermocycler must be able to heat up and cool down the reaction vessels used as quickly and precisely as possible. Typically, the temperatures it cycles through are between 95 °C and 60 °C or 72 °C.
Depending on the manufacturer, PCR thermocyclers differ in the reaction tubes used and in the way in which the tubes are heated and cooled. Another key difference is the way in which the PCR result is analysed. Standard thermocyclers in their original form can only heat and cool. This type of PCR is analysed in various ways (e.g. electrophoresis) after the actual PCR reaction.
In contrast, real-time PCR thermocyclers interpret the results during the reaction. These devices also have an evaluation unit that can measure and evaluate the fluorescence signals of a dye added to the reaction. Without this optical evaluation unit, PCR analysis would have to be performed in an additional reaction after the actual PCR reaction (e.g. by gel electrophoresis). Technical development in the field of real-time PCR analysers has accelerated and simplified the analysis and contributed greatly to establishing the method in the brewery sector.
Flow cytometer
Flow cytometry enables the automated measurement of particle or cell properties in suspension through simultaneous, multi-parametric analysis of the sample. In addition to cell counting in the liquid flow, it is possible to differentiate the particles or cells based on physical and molecular properties as well as the use of one or more fluorescent dye markers.
Design and mode of operation:
The functional principle of flow cytometric measurements is based on the emission of optical signals by the particles contained in the sample. These are usually cells. In the fluidics system of the flow cytometer, the particles are recorded in real time, enabling absolute cell counts based on volume. For this purpose, the sample material is surrounded by an enveloping flow of isotonic buffer solution and sucked through a cross-sectional constriction in a laminar flow. This process, known as hydrodynamic focussing, separates the cells.
The separated sample passes through one or more lasers with specific excitation wavelengths in the measuring cell; in some cases, xenon or argon lamps are also used. The resulting scattered light and fluorescence emissions can be used to generate electrical signals using appropriate detectors (photomultipliers), which are proportional to the intensity of the originally incident light.
A distinction is made between scattering signals and fluorescence signals. Scattering signals from forward light scattering allow conclusions to be drawn about the relative size of the particles, whereas signals from side-scattered light allow conclusions to be drawn about the structural properties and granularity. The fluorescence signals are dependent on the contained or bound fluorochromes. The type of fluorescent dyes used depends on a variety of factors, e.g. equipment (laser, filters and detectors), interactions with other dyes and the parameter to be determined.
The following cell analysis parameters can be determined using flow cytometry, whereby several properties can be recorded simultaneously depending on the assay:
Physiological parameters:
-
Cell growth
-
Metabolic activity
-
Membrane potential
-
Membrane integrity
Binding sites for fluorochromes or fluorescence parameters are:
-
Nucleic acids (DNA, RNA)
-
Proteins
-
Lipids
-
Intracellular pH value
-
Fluorescent substrates
-
Membrane potential
-
Cations (Ca2+)
-
Antibodies
-
Autofluorescent proteins
etc.
MALDI-TOF mass spectrometry
Mass analysis using MALDI (matrix-assisted laser desorption ionisation) and subsequent time-of-flight analysis (TOF) is suitable for the rapid identification of microorganisms. The spectra for microbiological identification usually show specific peptide profiles or protein profiles of ribosomal proteins.
Structure and function:
A sample is mixed with a protective liquid matrix and applied to a sample carrier and fixed there by crystallisation. At the start of measurement, the matrix is vaporised using a pulsed laser and the bound biomolecules are dissolved (desorption) and ionised. The ions are then accelerated in an electric field and detected using a time-of-flight mass spectrometer.
The spectra generated can be compared with reference spectra from a database, thereby resulting in the identification of the sample. It is important to use pure cultures; prior isolation of the organisim is absolutely essential.
FT-IR spectrometer
A Fourier transform infrared spectrometer enables the fast and cost-effective identification of bacteria and yeasts in brewery microbiology. An interferogram measured using an FT-IR spectrometer is used to calculate a specific spectrum via Fourier transformation, which can then be compared with a corresponding database.
A prerequisite for successful identification is the use of pure cultures, which requires prior isolation. Standardised growth conditions are also required, as deviations have a direct effect on the final spectrum.
This method describes the visual determination of glassiness in malt.
Malt intended for use in beer brewing or elsewhere in the food industry.
Visual evaluation of longitudinally cut endosperms of malt kernels
This method describes how to conduct a stress test for non-alcoholic beverages (NAB).
non-alcoholic beverages (soft drinks containing natural aromas and flavors, soft drinks containing artificial aromas and flavors, beverages containing fruit juice)
The time required to develop a product – from conception to launch on the market – is steadily shrinking. Since recipes are also becoming ever more complex and a wide range of different types of packaging are now employed, forced stability tests have become absolutely essential, in order to establish a realistic indication of a product’s shelf-life.
Inferences about the shelf-life of a product can only be made if the entire beverage concept is taken into consideration, such as the recipe, filling technology, packaging and distribution.
The most important stress factors in the aging process are heat, light and oxygen.
PET bottles have become a popular form of packaging for non-alcoholic beverages, and their permeability to gas, most especially oxygen, is therefore a critical parameter in the aging process.
The testing process described below operates, of course, on the assumption that the chemical reactions in the aging process are subject to the same mechanisms, whether they occur at temperatures typical for beverage storage or at somewhat elevated temperatures, and that they follow a linear relationship dependent on temperature. The same applies to forced photochemical reactions and to reactions brought about by an increase in the partial pressure of oxygen on the beverage. To verify results from forced testing, they can be compared and correlated to results from real-time tests on the same product.
This method describes the procedure for conducting a stress test for water containing added aroma.
Water with added aroma
The time required to develop a product – from conception to launch on the market – is steadily shrinking. Since recipes are also becoming ever more complex and a wide range of different types of packaging are now employed, forced stability tests have become absolutely essential, in order to establish a realistic indication of a product’s shelf-life.
Inferences about the shelf life of a product can only be made if the entire beverage concept is taken into consideration, such as the recipe, filling technology, packaging and distribution.
The most important stress factors in the aging process are heat, light and oxygen.
PET bottles have become a popular form of packaging for non-alcoholic beverages, and their permeability to gas, most especially oxygen, is therefore a critical parameter in the aging process.
The testing process described below operates, of course, on the assumption that the chemical reactions in the aging process are subject to the same mechanisms, whether they occur at temperatures typical for beverage storage or at somewhat elevated temperatures, and that they follow a linear relationship dependent on temperature. The same applies to forced photochemical reactions and to reactions brought about by an increase in the partial pressure of oxygen on the beverage. To verify results from forced testing, they can be compared and correlated to results from real-time tests on the same product.
This method describes the procedure for conducting a stress test on non-alcoholic beverages.
Non-alcoholic beverages (soft drinks, beverages containing fruit juice)
The time required to develop a product – from conception to launch on the market – is steadily shrinking. Since recipes are also becoming ever more complex and a wide range of different types of packaging are now employed, forced stability tests have become absolutely essential, in order to establish a realistic indication of a product’s shelf-life.
Inferences about the shelf life of a product can only be made if the entire beverage concept is taken into consideration, such as the recipe, filling technology, packaging and distribution.
The most important stress factors in the aging process are heat, light and oxygen.
PET bottles have become a popular form of packaging for non-alcoholic beverages, and their permeability to gas, most especially oxygen, is therefore a critical parameter in the aging process
The testing process described below operates, of course, on the assumption that the chemical reactions in the aging process are subject to the same mechanisms, whether they occur at temperatures typical for beverage storage or at somewhat elevated temperatures, and that they follow a linear relationship dependent on temperature. The same applies to forced photochemical reactions and to reactions brought about by an increase in the partial pressure of oxygen on the beverage. To verify results from forced testing, they can be compared and correlated to results from real-time tests on the same product.